Features at a glance
Trading journal, market data and analytics for IBKR traders - in one desktop app, with all data stored locally on your machine.
All screenshots are taken from the running app (demo data). Click one to enlarge it.
Trading journal for stocks, futures and options
Every trade lands in the journal automatically, via the TWS API or the Flex Web Service, no manual uploads. Stock, futures and option trades live in the same journal, with partial exits, remaining positions and fees. The option strategy is detected from the legs: iron condor, butterfly, covered call, spreads and more.
- Automatic strategy detection incl. broken-wing and ratio variants
- Splits, symbol renames and corporate actions are tracked
- Configurable columns, cascading filters, tags, mistake and strategy assignment, comment trades and attach images
- Open, partially closed and closed positions at a glance
- Split and merge tools for clean trade histories
- FX conversion for multi-currency accounts
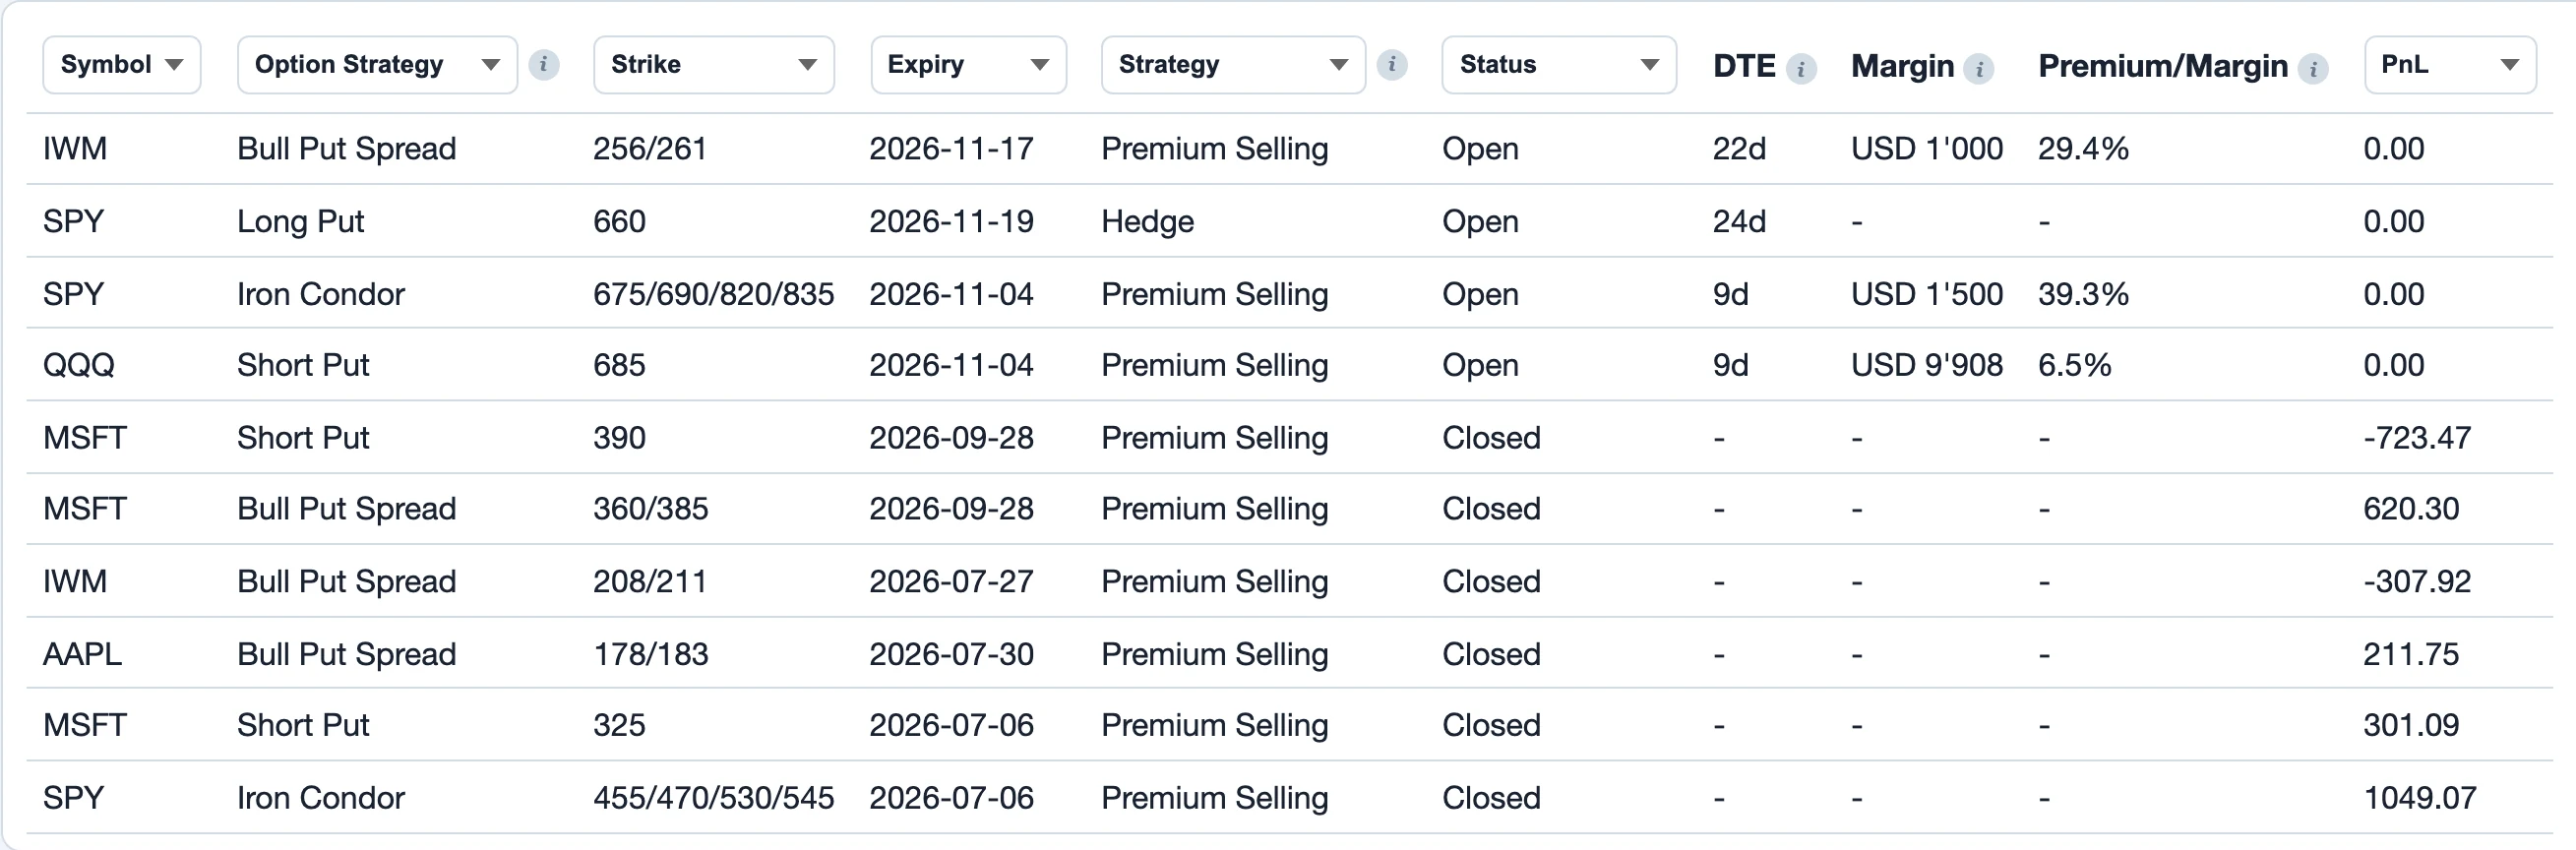
- 1Option strategy, detected from the legs
- 2Your own strategy, such as premium selling or hedge
- 3Premium in percent of the margin at opening
Market overview
Volatility gauges, indices and the US yield curve with percentile context, plus the VIX futures curve with contango display and EMA21 counts across markets - daily and weekly.
- Volatility for SPX, NQ and RUT, VVIX, SKEW, VIX/VIX3M ratio and put/call ratios with historical percentiles and as charts
- Various interest rate metrics with historical percentiles and as charts
- VIX term curve as a chart
- EMA21 counts as a heat table across indices and futures
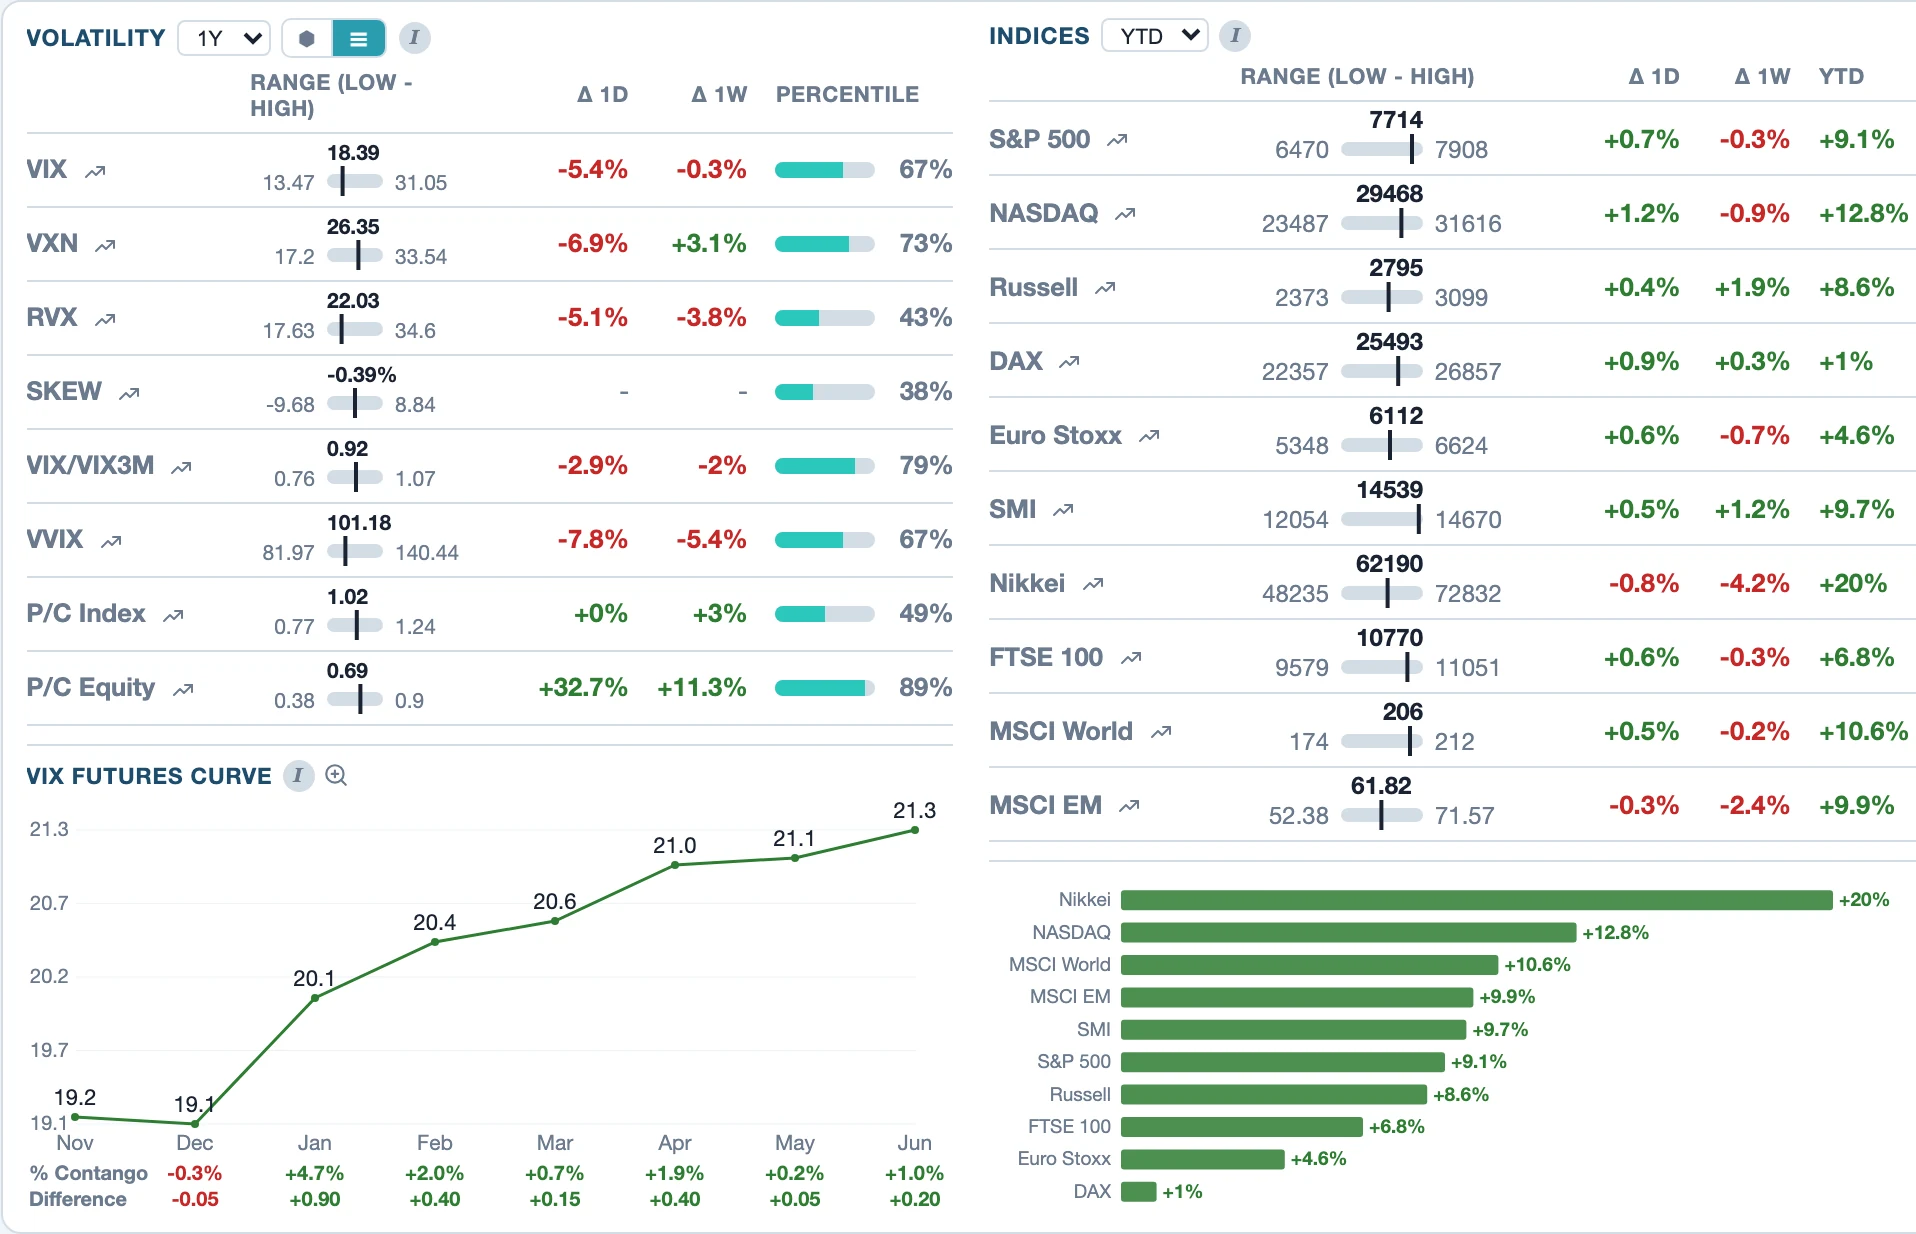
- 1Volatility with one-year range, change and percentile
- 2VIX futures curve with contango and difference per month
- 3Indices with range, change and YTD
- 4Indices ranked by YTD return
Futures: CoT, term structure, IVR
For over 30 futures markets: CoT index from CFTC data, term structure with contango/backwardation display, open interest, IV rank and IV percentile - all in one table.
- CoT index with hi/lo marking of extremes
- Term structure miniatures per market
- IVR and IVP from IBKR options data
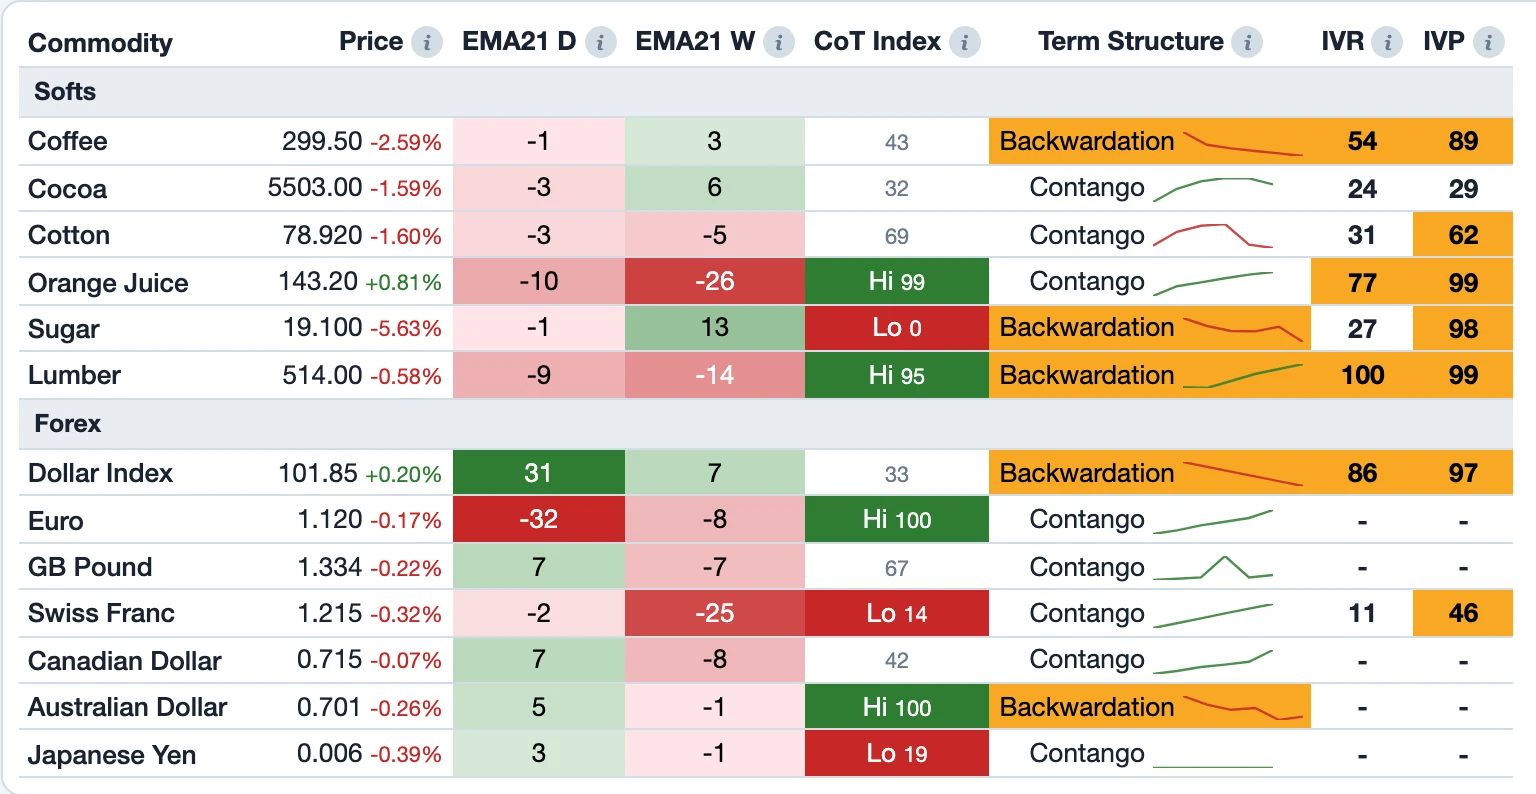
- 1CoT index with Hi/Lo marks for extreme values
- 2Term structure: contango or backwardation with a mini curve
- 3IV rank and IV percentile from IBKR options data
ETF heatmap and screener
Around 250 US-listed ETFs in 17 categories as a sortable heatmap: returns from one day to three years, EMA21 streaks, distance to the 52-week high and a column group with options data from your Trader Workstation. Threshold filters and saved screens narrow the universe down.
- Options columns: IV, IV rank, IV percentile, IV/HV, expected move, open interest, put/call ratio and days to ex-dividend
- Tiles view by fund assets, compare mode and world map of country ETFs
- Chart panel with expected-move cone, IV history and holdings per ETF
- Category filter, symbol search and favorites
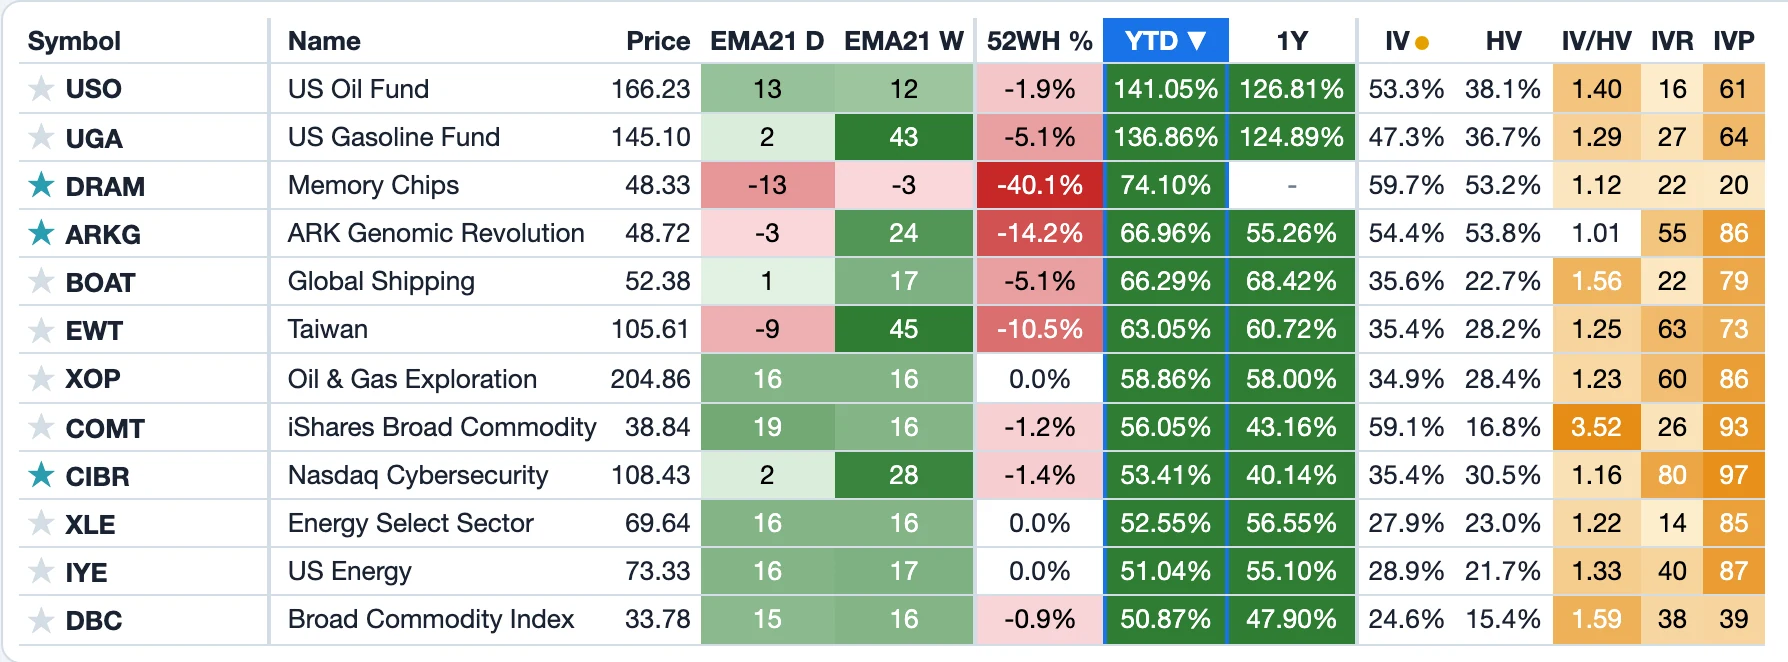
- 1EMA21 streaks daily and weekly
- 2Distance to the 52-week high
- 3Options data from TWS: IV, HV, IV/HV, IV rank and IV percentile
Commodity fundamentals
Public fundamental data right in the app: EIA energy inventories, USDA crop conditions and stocks, WASDE supply and demand figures and FAS export sales - each with 5-year ranges.
- Crude oil, gasoline, distillates and natural gas with seasonality
- Corn, soybeans, wheat: condition, stocks and WASDE
- Sources and timestamps right on each panel
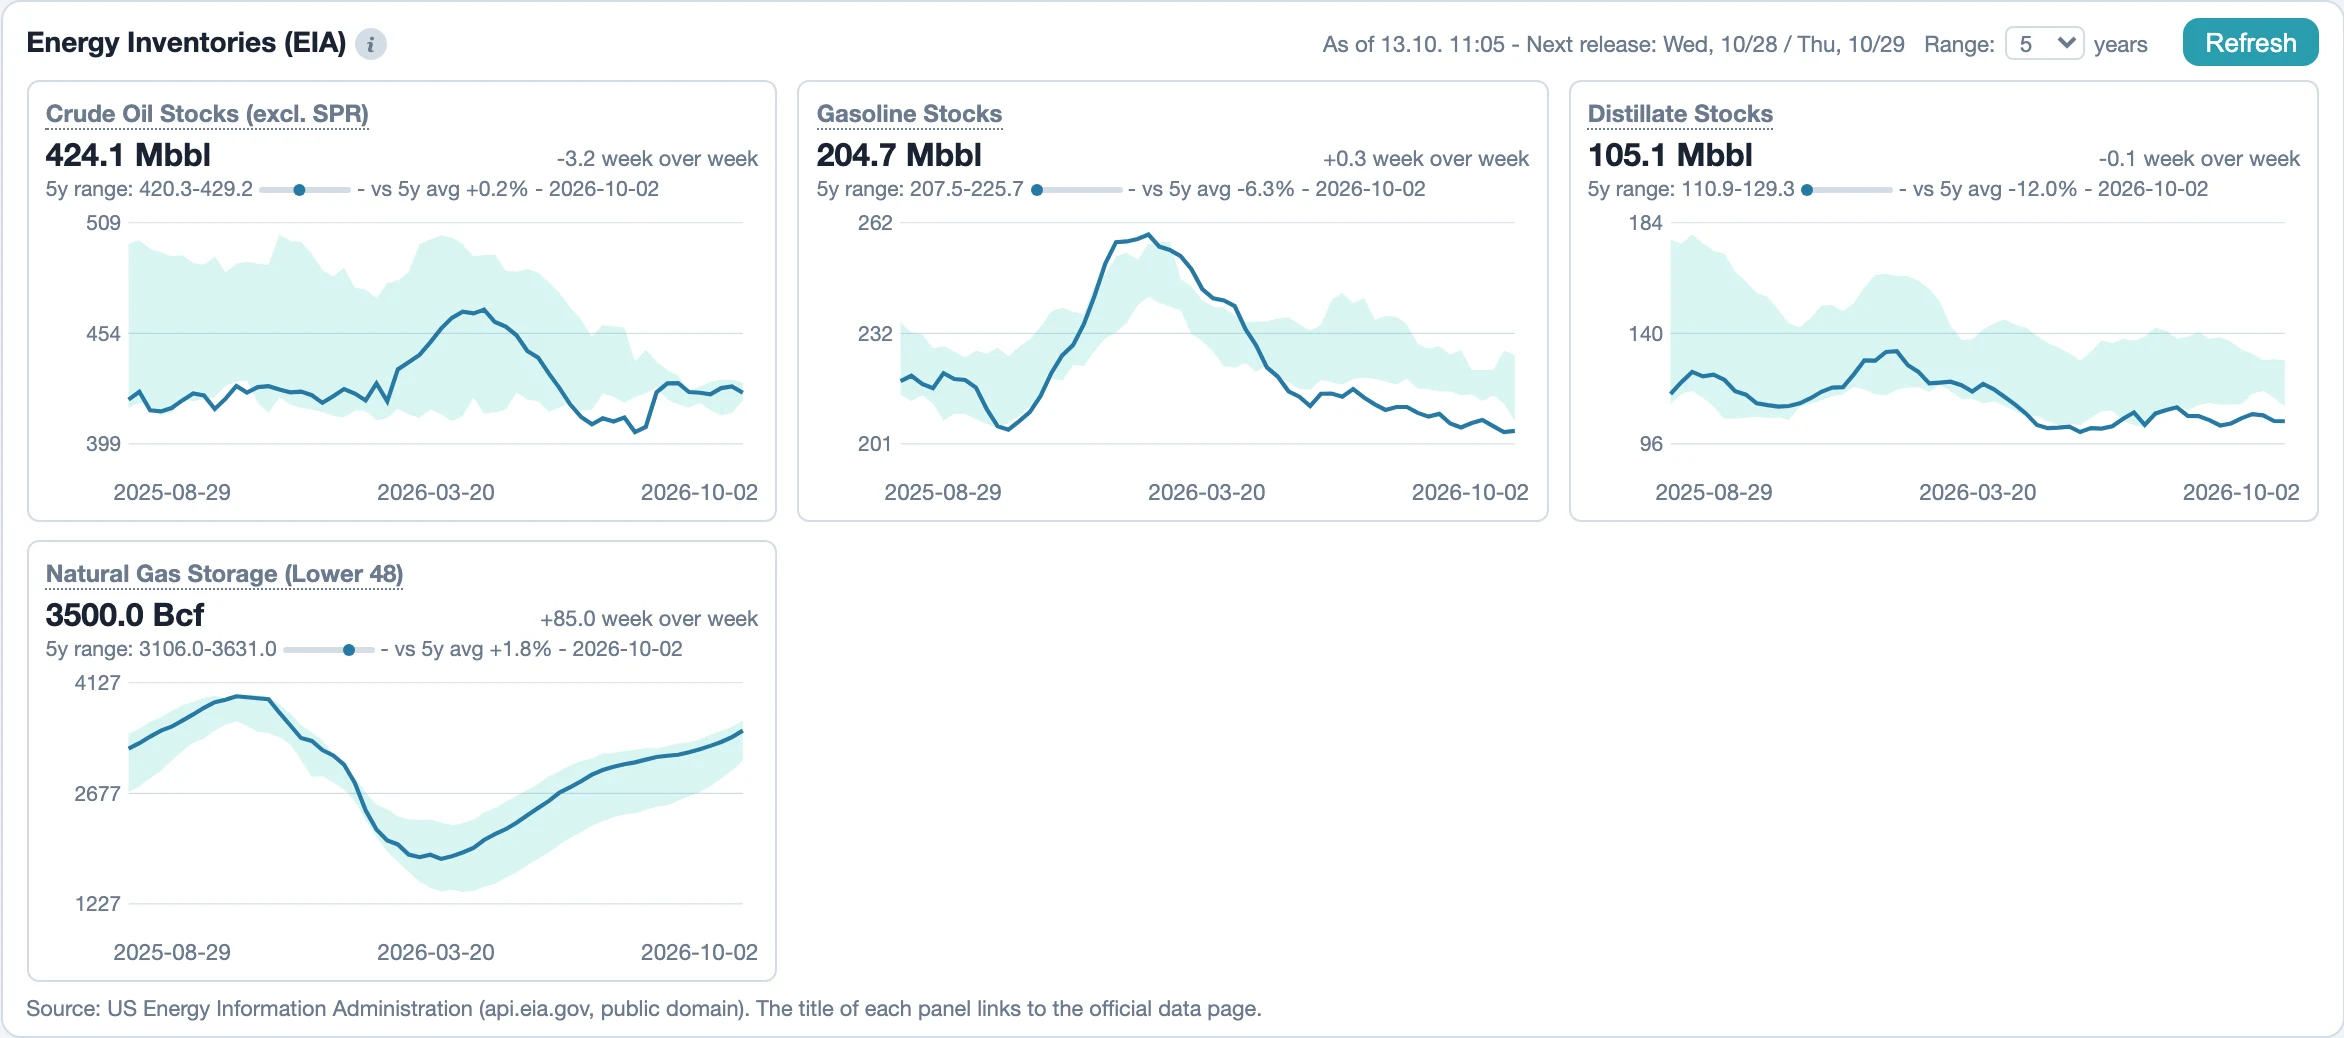
- 1Crude oil stocks with the 5-year range as a band and the gap to the 5-year average
- 2Natural gas storage with its seasonal course
Macro data (FRED)
Yield curve, inflation series, labour market and business cycle data from the Federal Reserve FRED database - as charts with history.
- US yield curve over time
- Consumer prices, core inflation and producer prices
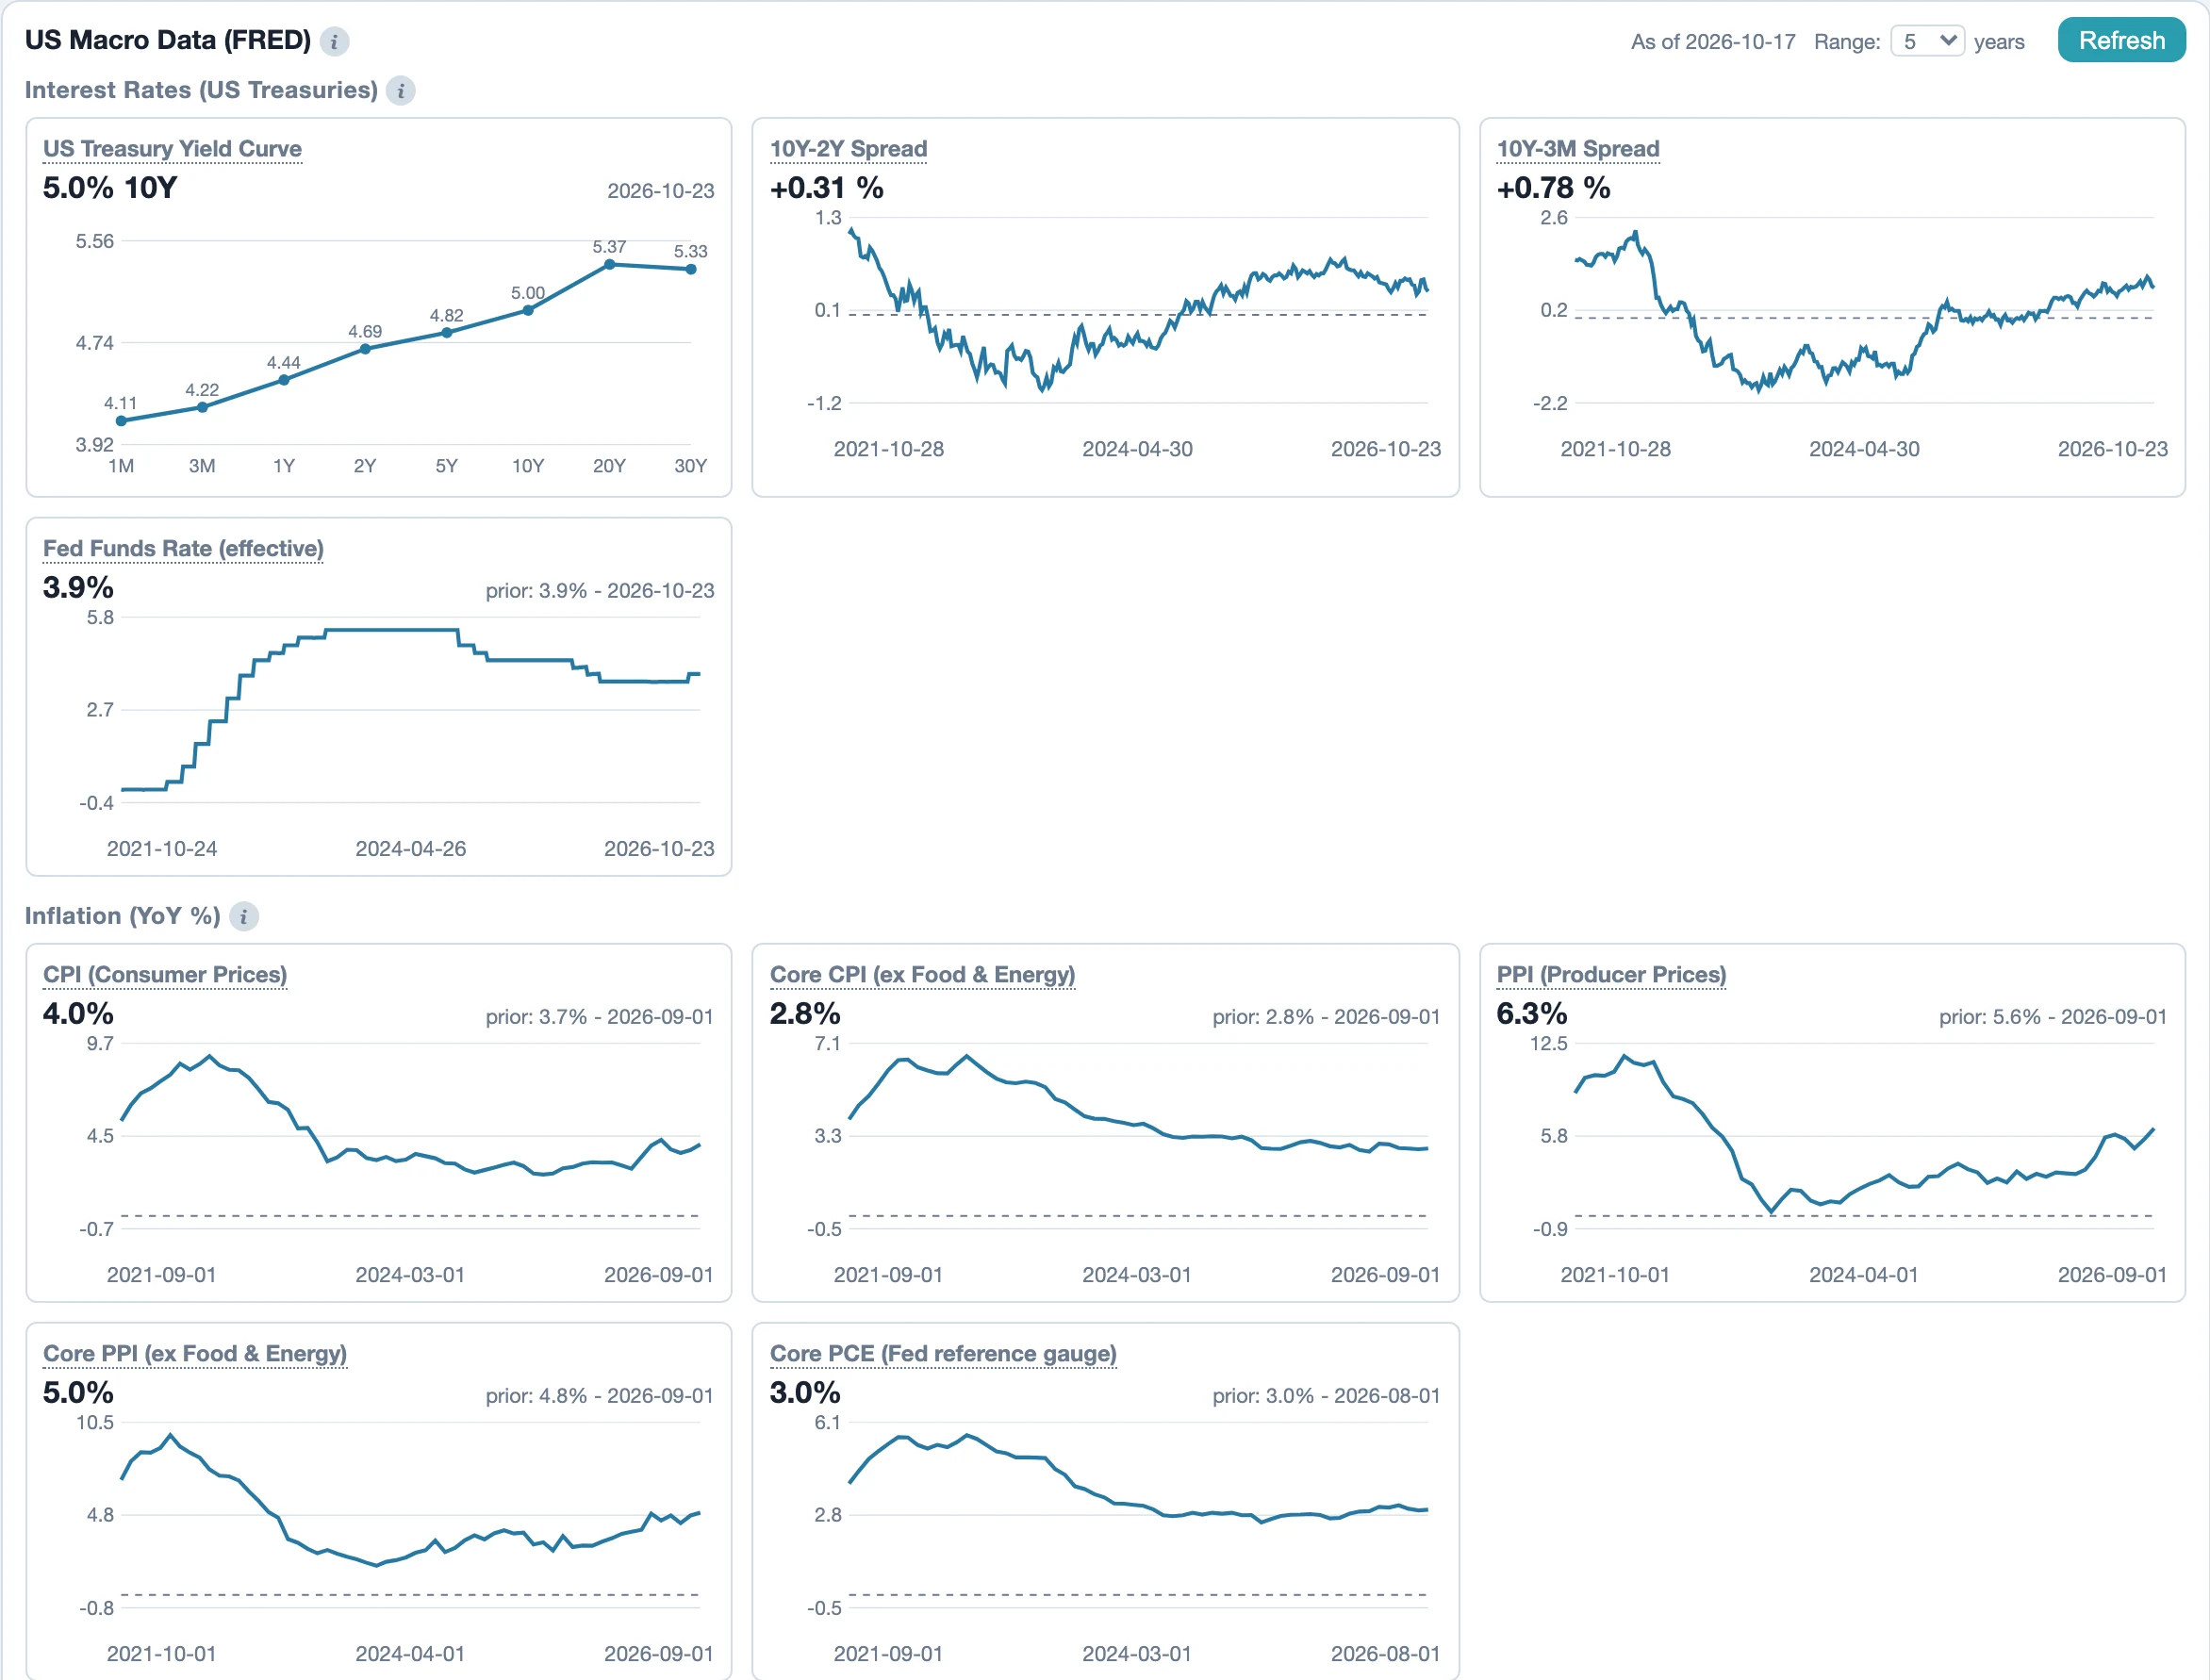
- 1Rates: yield curve, 10Y-2Y and 10Y-3M spreads, fed funds rate
- 2Inflation year over year: CPI, core CPI, PPI, core PPI and core PCE
Analytics and metrics
Win rate, profit factor, expectancy, Sharpe, Sortino, drawdown and capital flows - filtered by period, type, strategy or symbol. Rolled options are evaluated as connected trades.
- Equity, drawdown and distribution charts
- Performance by category and strategy
- Roll detection with efficiency metrics
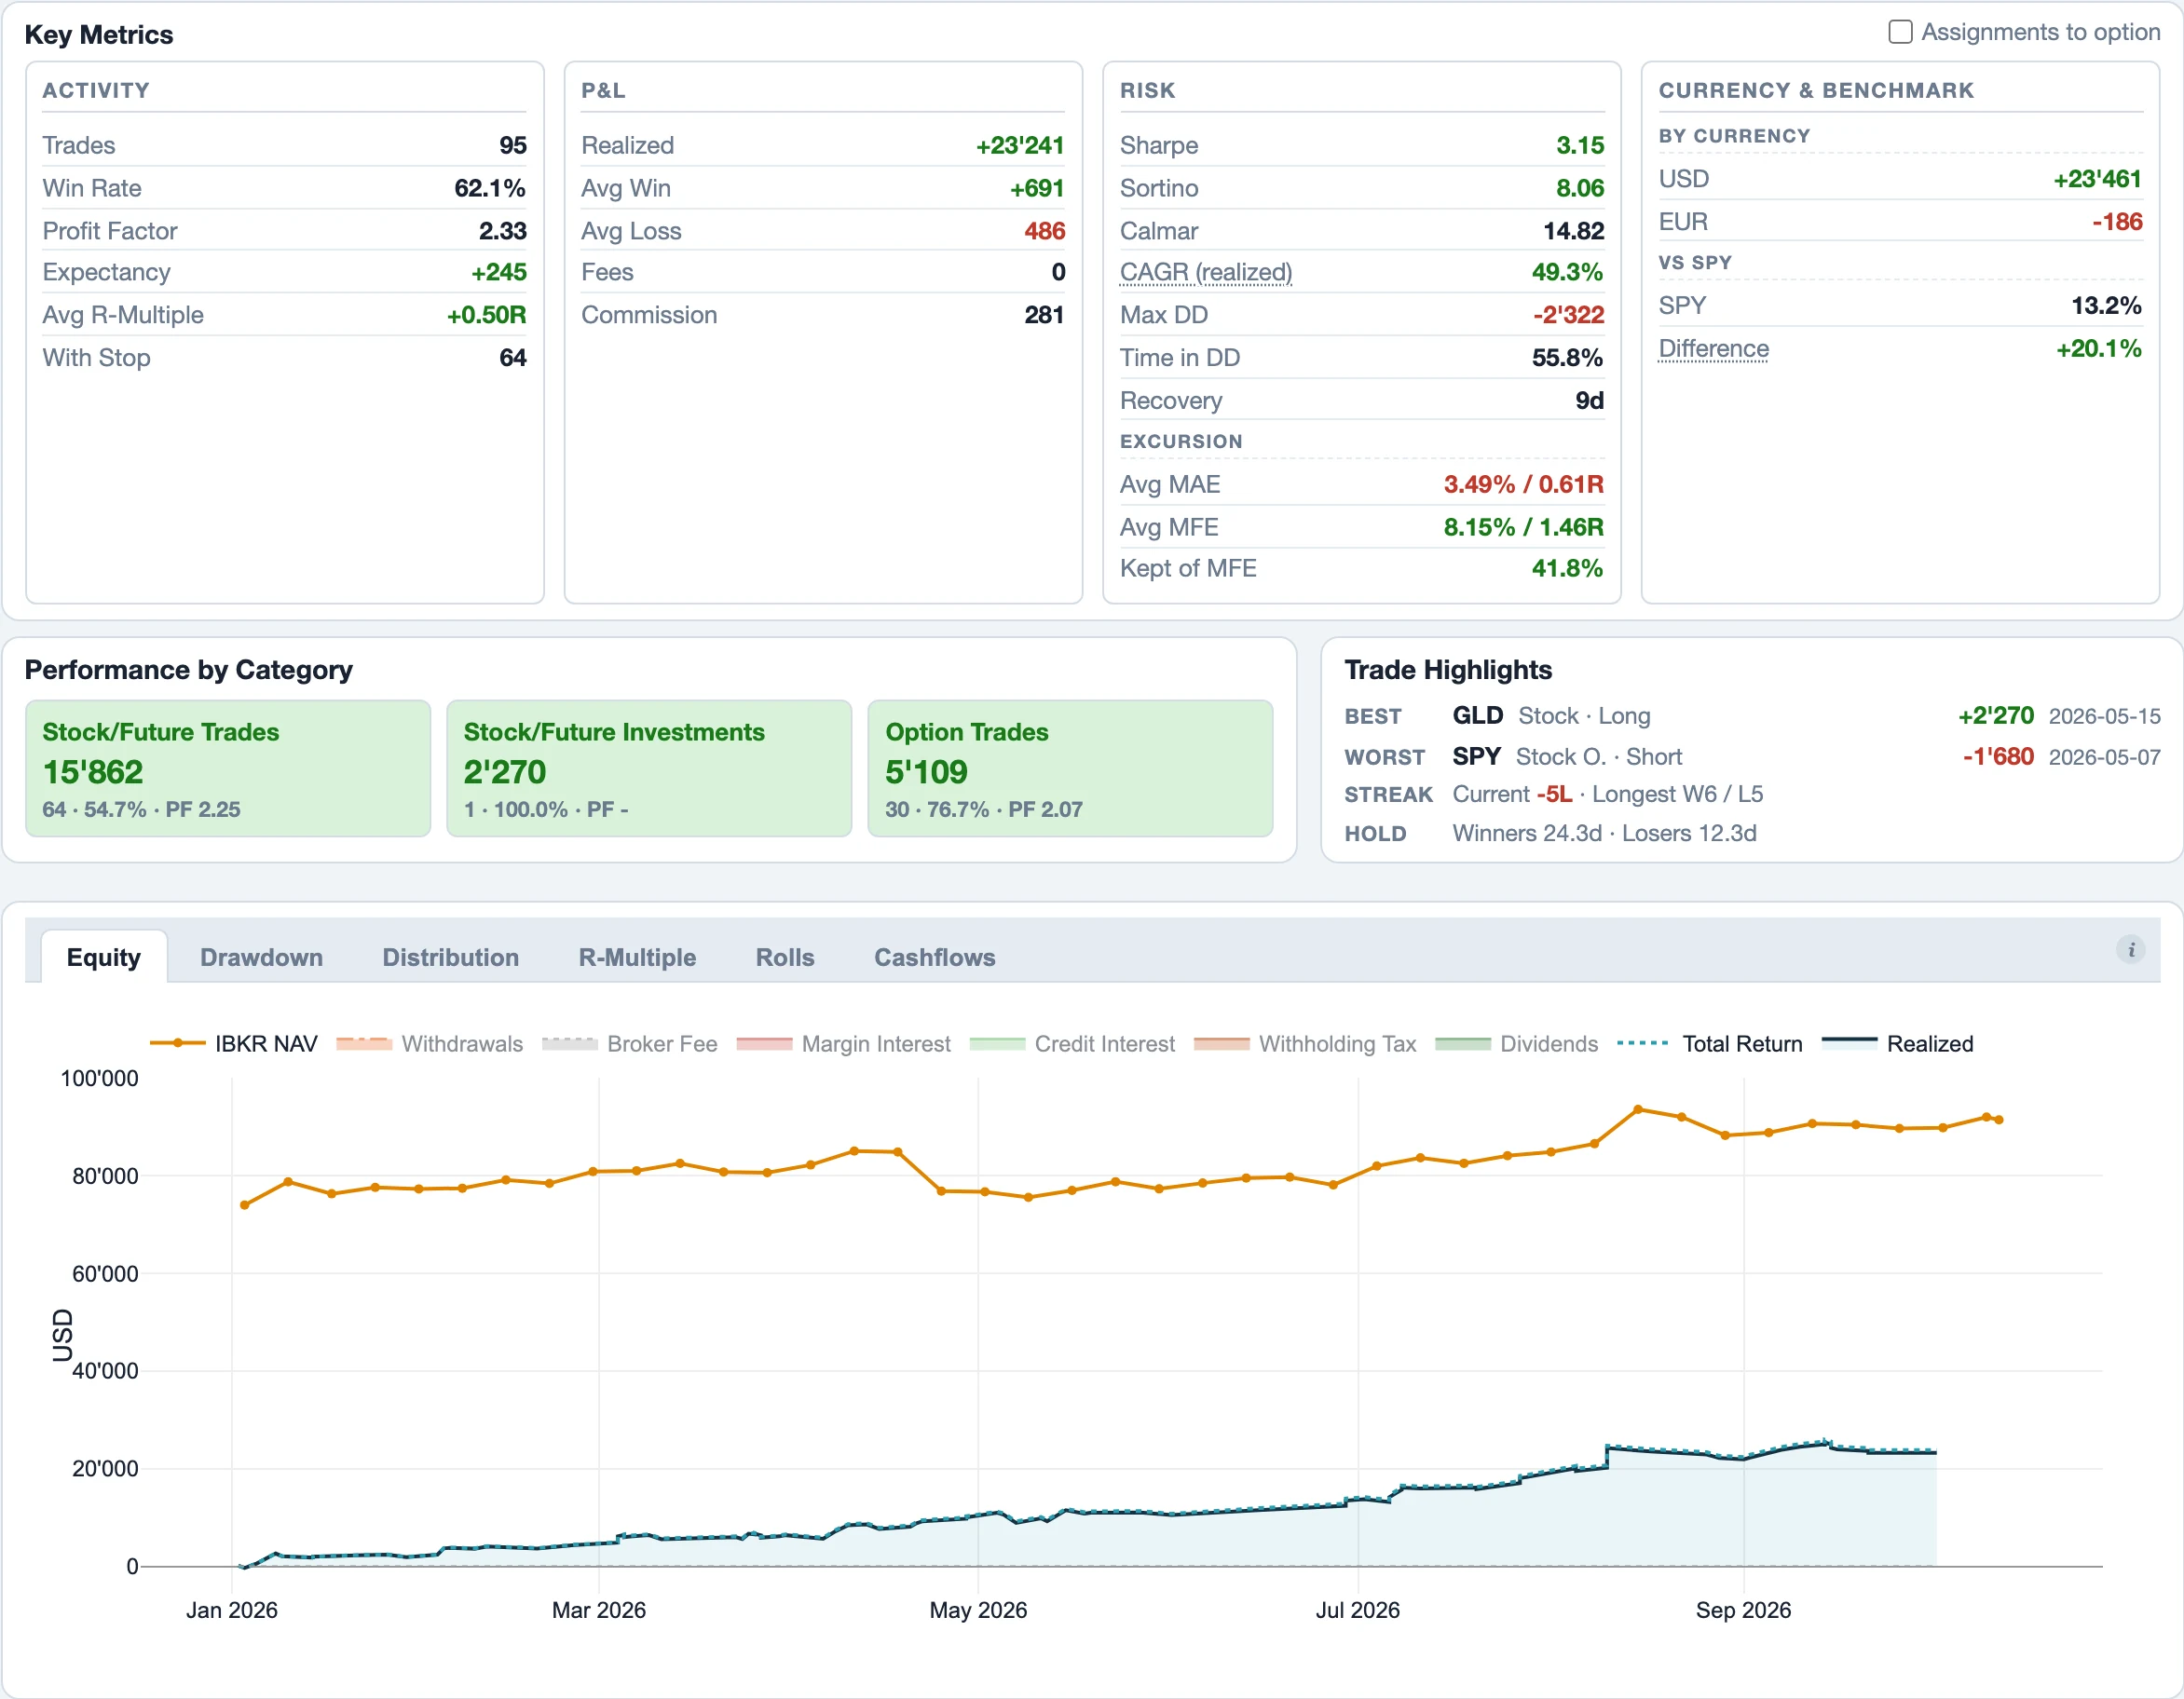
- 1Key metrics: activity, P&L, risk, currency and benchmark
- 2Performance by category
- 3Equity curve with IBKR NAV, total return and realized
Dashboard with guided setup
The dashboard shows account value, daily change, sold option premium, global indices, top/flop ETFs and recent earnings. A checklist guides you through setup - from the Flex token to optional API keys.
- Net liquidation value and P&L straight from your IBKR account
- Global indices with YTD and 52-week ranges
- Step-by-step setup, optional data sources clearly marked
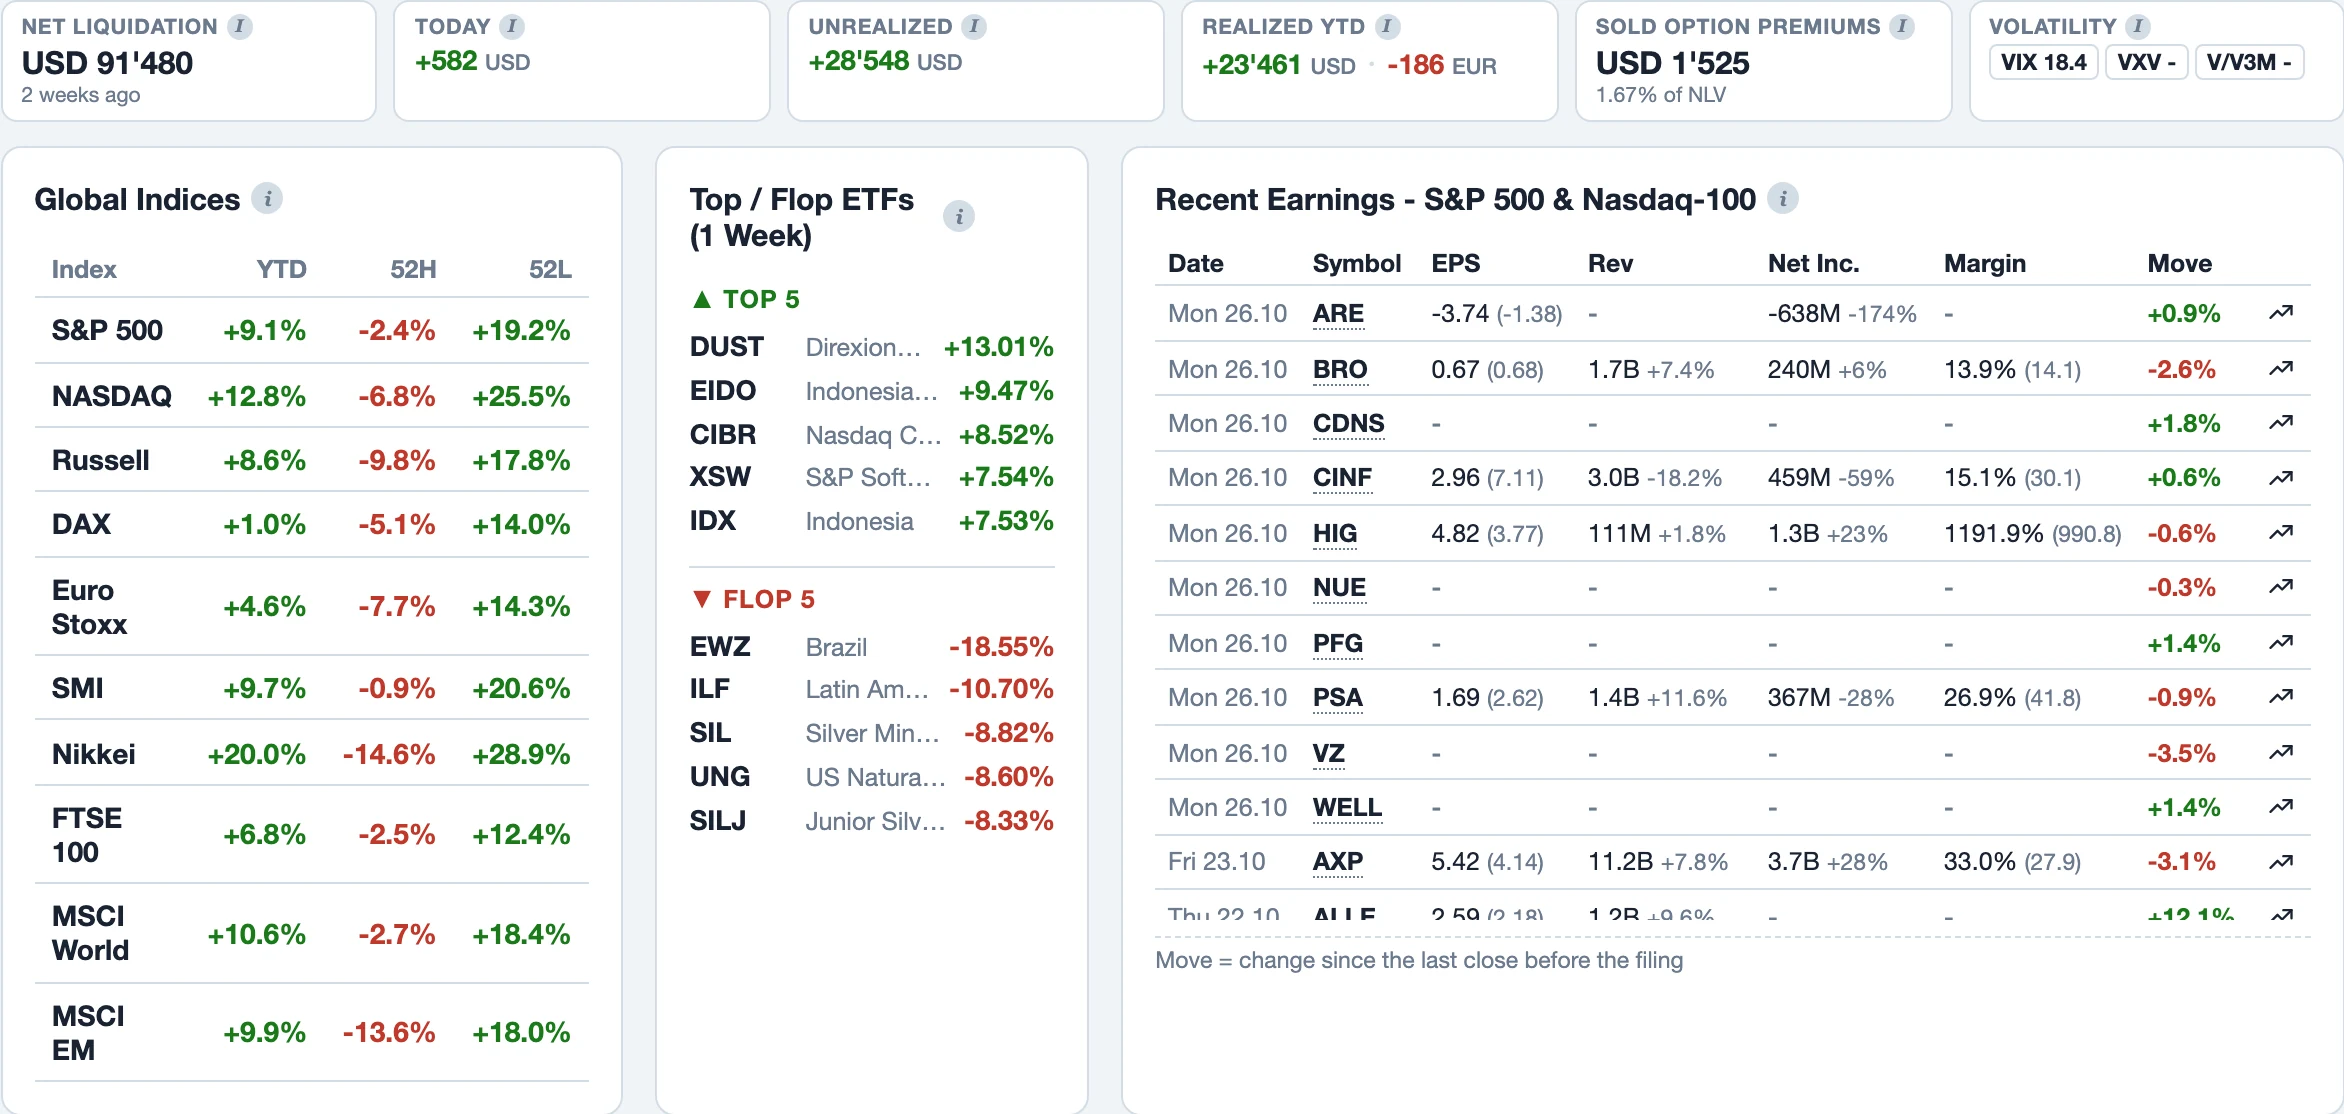
- 1Account value, P&L today, unrealized, realized YTD, sold premiums and volatility
- 2Global indices with YTD and the distance to the 52-week high and low
- 3Top and flop ETFs of the week
AI trade review
Have individual trades reviewed by an AI model of your choice - OpenAI, Gemini or Anthropic, using your own API key. Data goes exclusively to the provider you pick.
Automation and backups
Sync every 10 minutes, market data refresh in the background, daily journal backups as ZIP with retention rules - all hands-off, visible in the jobs dashboard.
Local instead of cloud
All trades live in a SQLite database on your machine. No account upload, no tracking, offline license validation. Journal and analytics work without internet. Import, market data, the optional AI review and the update check need a connection.
German and English
The entire app is bilingual - switchable with one click, help pages included.